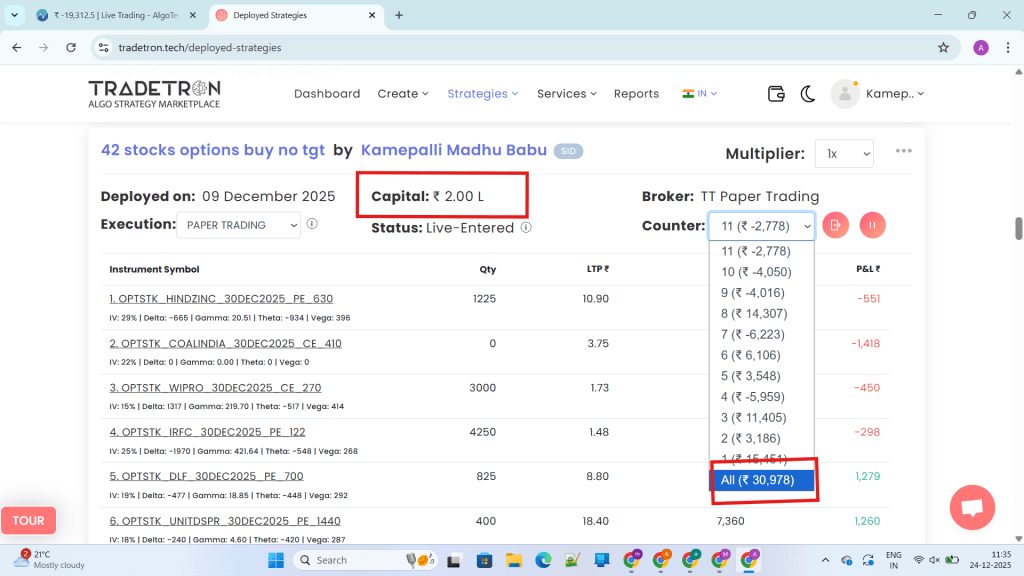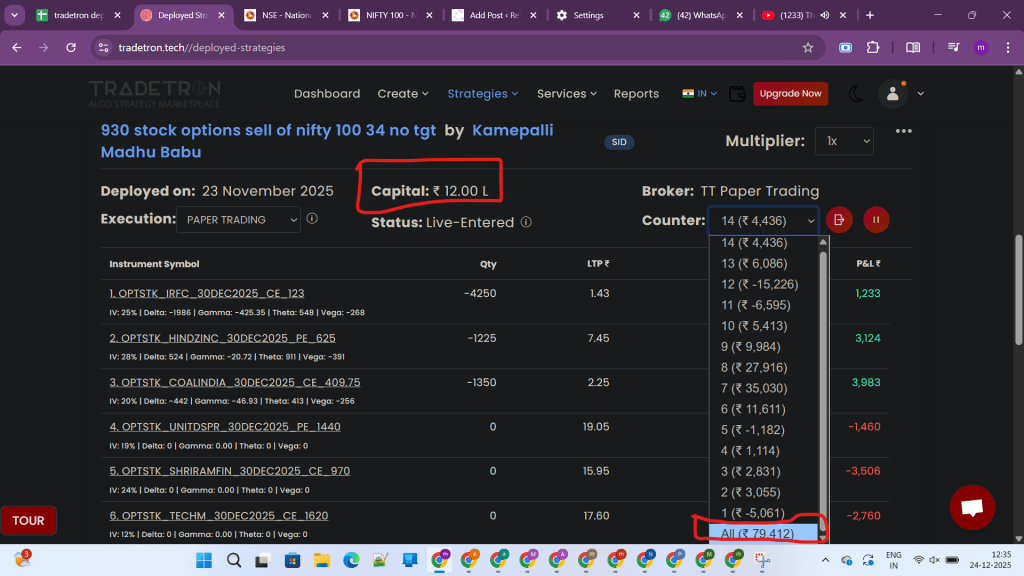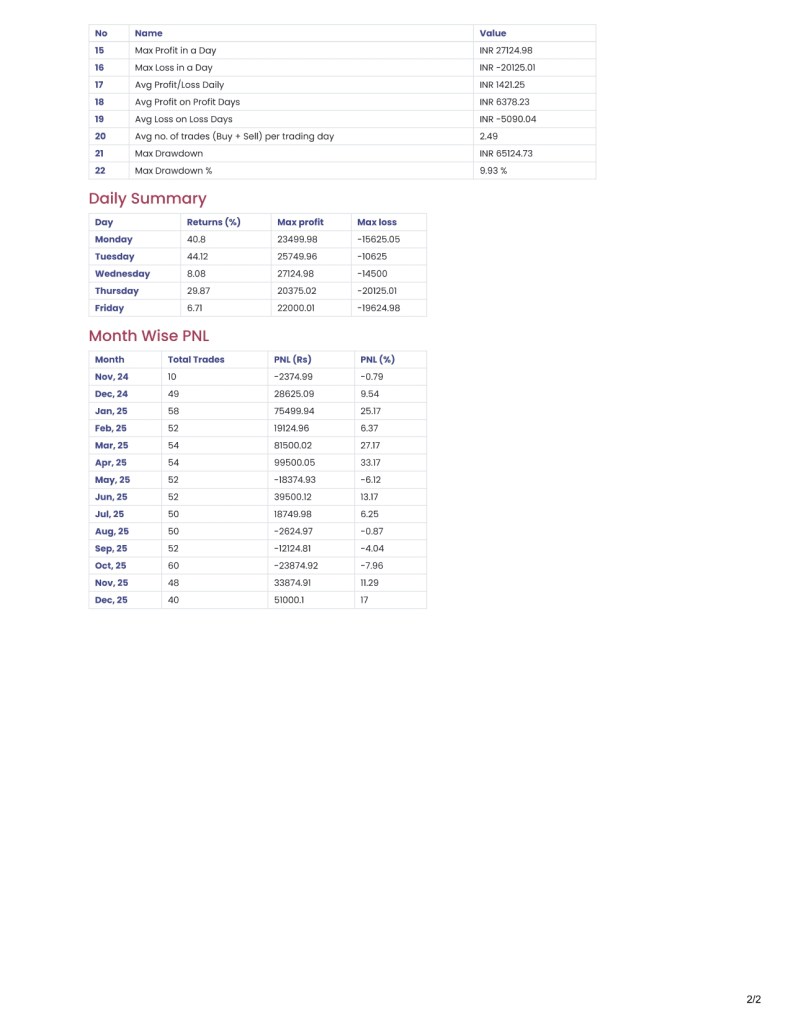
On 24 December 2025, a simple Hindustan Zinc (HINDZINC) options strategy exposed a harsh reality of algo trading: the backtest said one thing, but the live P&L told a completely different story. Even after applying a seemingly conservative 1% slippage in the backtest, there was still almost ₹1,000 difference between the “expected” and “actual” results, raising a crucial question: how realistic are our backtests, really?
The HindZinc 24 December Case Study
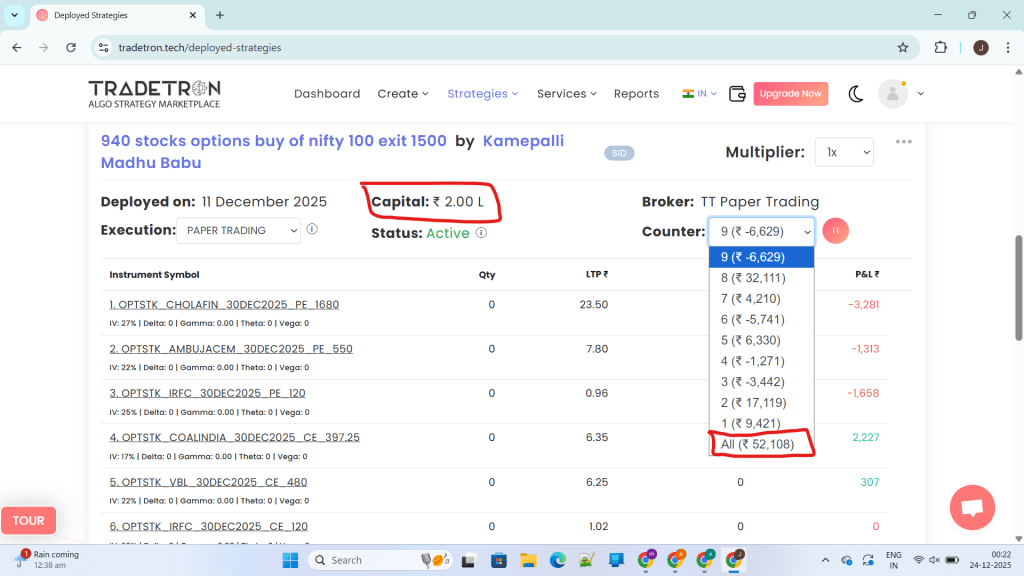
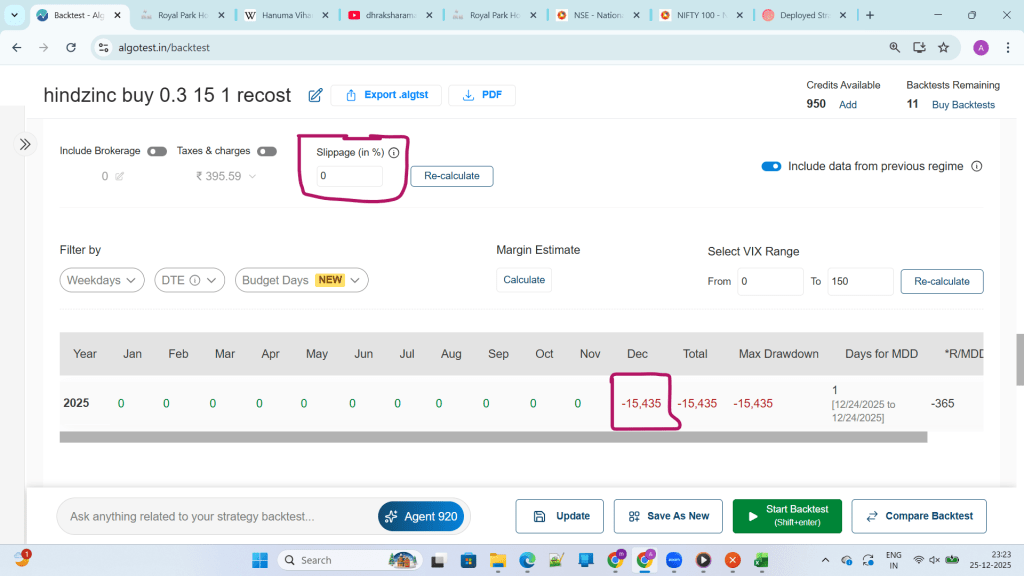
On the backtesting screen, the HindZinc buy strategy for 24 December 2025 looked manageable.
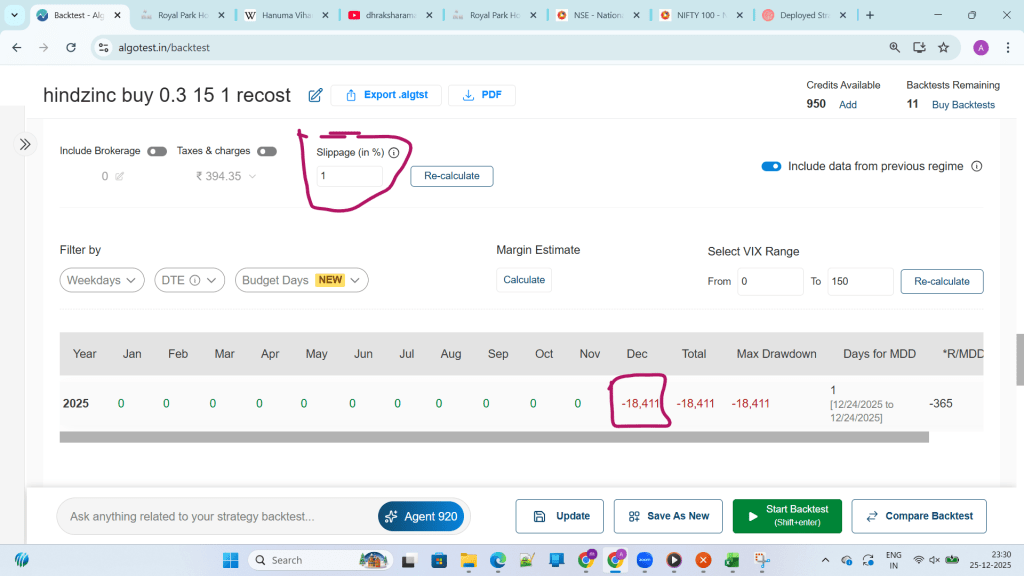
The day showed a controlled loss with a specific maximum drawdown, and with 1% slippage applied, the system appeared to be giving a “realistic” picture of execution costs.
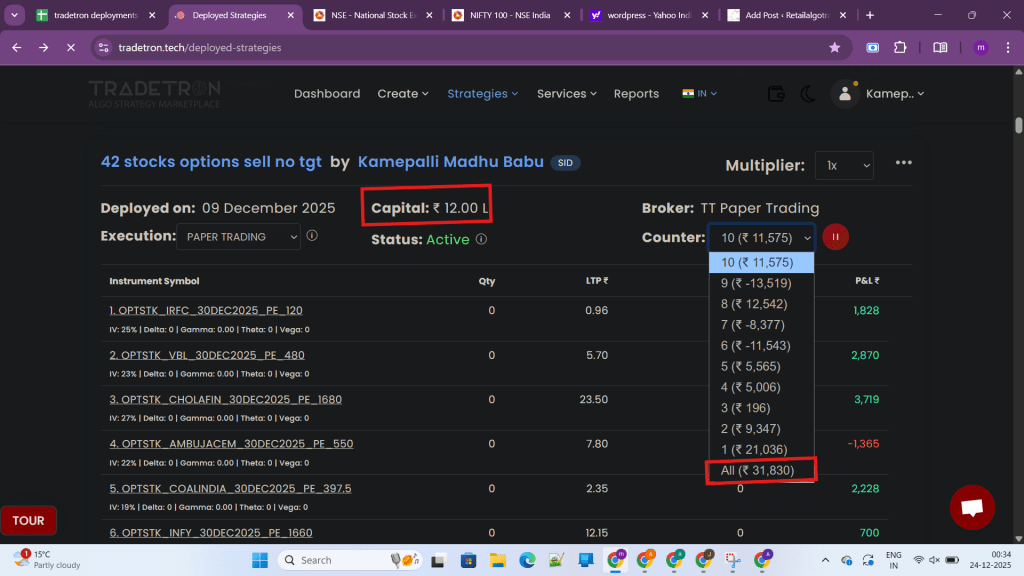
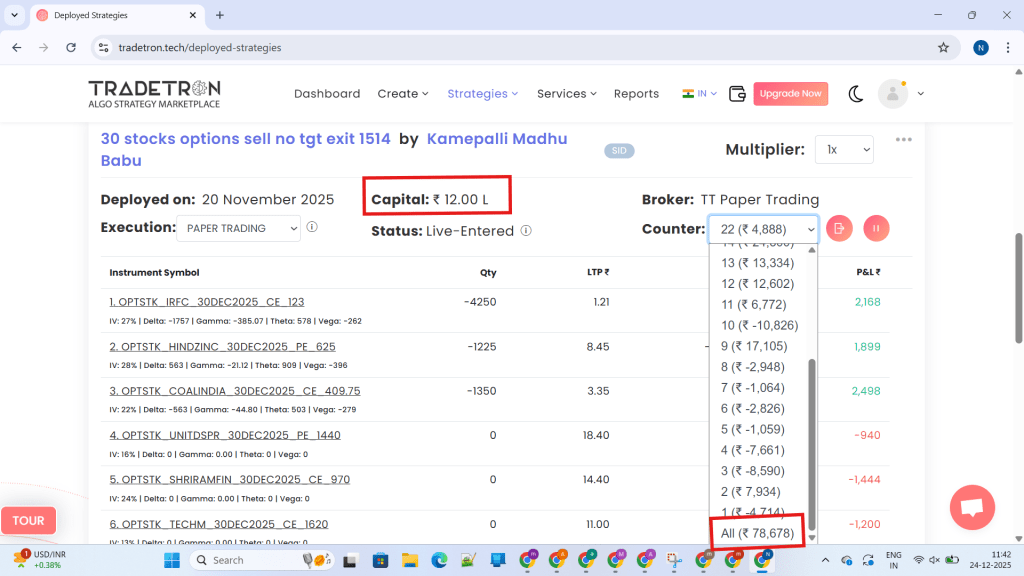
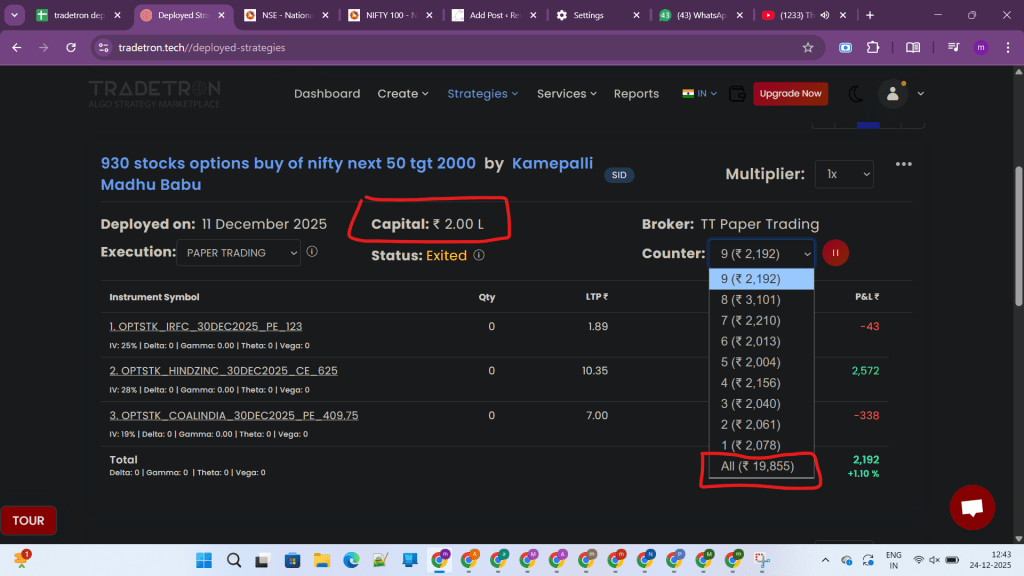
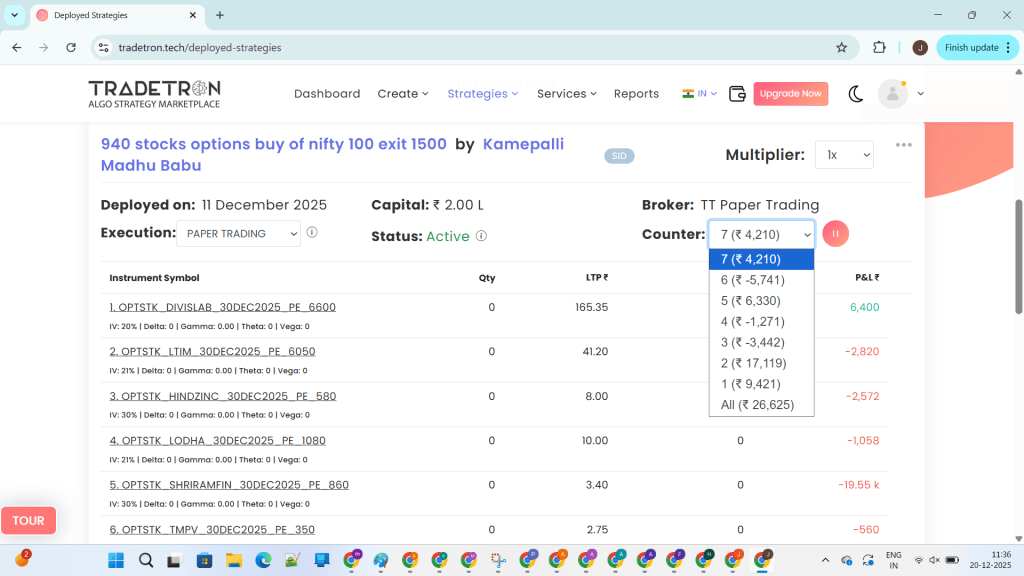
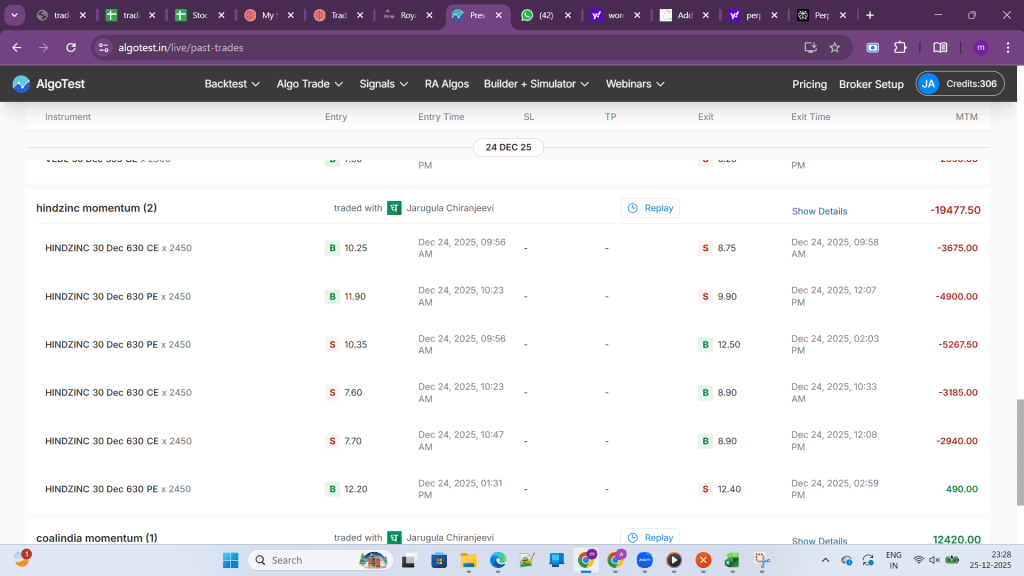
However, in real trading, the same HindZinc options strategy produced a much larger loss.
Multiple trades in out‑of‑the‑money and at‑the‑money options entered and exited at prices that were noticeably worse than what the backtest assumed, even though the slippage setting was already at 1%.
That gap between the backtest P&L and live P&L is not a random accident; it is the natural outcome of how backtests model the market versus how the market actually behaves.
What Slippage Really Means in Practice
In simple terms, slippage is the difference between the price you want and the price you get when your order is filled.
Backtesting platforms allow you to plug in a fixed percentage slippage, but under the hood they still assume that your orders are executed optimally within each candle, without any view of the live order book, queue priority, or latency.
In liquid index options such as NIFTY or BANKNIFTY, typical slippage can often stay within 0.3–0.5% when using smart order execution.
But in single‑stock options like HindZinc—especially near expiry or in low‑volume strikes—bid‑ask spreads are wider, depth is shallow, and a relatively small market order can easily chew through multiple levels and create 1–2% or more slippage on a single trade.
When a strategy repeatedly buys and sells such instruments during a trending or volatile session, the compounding of these small execution disadvantages turns into a visible gap between backtest and live performance.
Why Backtests and Live Trades Diverge So Much
Several structural reasons explain why your HindZinc live trades on 24 December diverged from the AlgoTest backtest, even with 1% slippage configured.
1. Candle‑Level Assumptions vs Tick‑Level Reality
Backtests generally use one‑minute OHLC candles for options and assume your trade happens at a representative price within that candle.
If a one‑minute candle has an open at 10, a high at 13, a low at 9, and a close at 11, the backtest may assume you entered around 10–11 and exited around 11–12, with your fixed slippage layered on top.
In live markets, your order is matched at a specific tick, and the price path inside that one‑minute candle matters.
If HindZinc jumps sharply from 10 to 12.50 and back to 11 within seconds, your market order could fill near the extreme, while the backtest “chooses” a fair‑looking level within the candle.
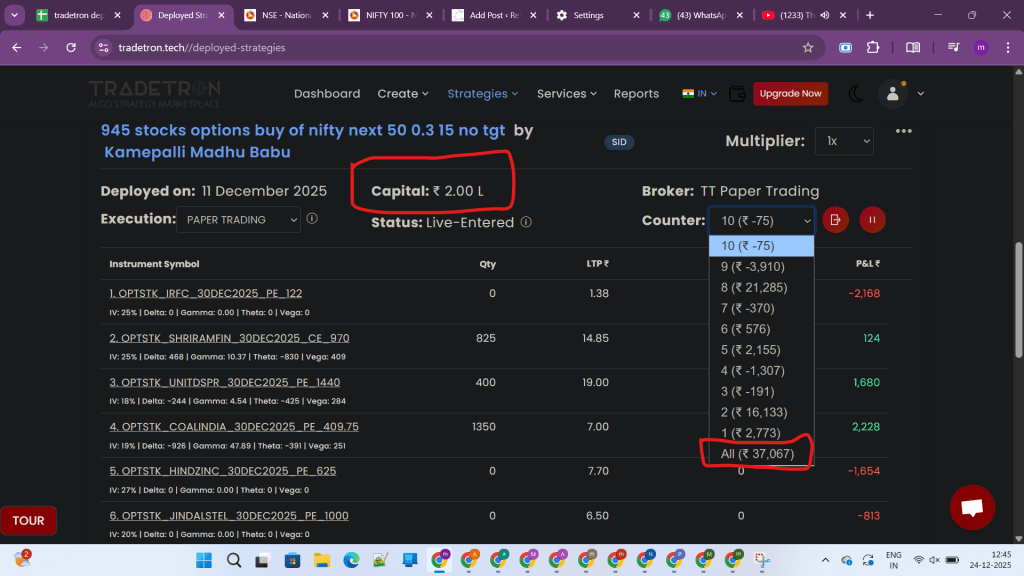
2. Re‑Entries, Recosting, and Compounding Error
Your HindZinc strategy likely uses re‑entries or recosts (for example, fresh entries when a new ATM option is selected or when a momentum condition is met).
Backtests handle these logic points using candle data and idealized fills, so every re‑entry is simulated as if the market instantly gives a clean execution at or near the reference price.
In live trading, each new order is subject to spread, depth, latency and partial fills.
A difference of 10–15 paise per lot on several re‑entries across thousands of quantity can stack into hundreds or thousands of rupees by the end of the day, which is exactly what your P&L screenshot reflects.
3. Option Buying Is Naturally Slippage‑Heavy
Option buying strategies cross the spread more aggressively because they typically use market or aggressive limit orders to ensure entry.
Community discussions and platform guidelines often recommend assuming around 1% slippage for such strategies, not because 1% always happens, but because spikes beyond 1% are frequent enough in thinly‑traded names.
On 24 December, HindZinc options likely had:
- Wider spreads than index options.
- Sudden jumps in last traded price as larger orders hit the book.
- Lower depth at mid‑day and towards close.
In that environment, even a 1% backtest assumption is optimistic; individual trades can show 1.5–2% or more deviation, which backtests simply cannot reproduce with a single static number.
4. Latency, Broker, and Infrastructure Effects
Backtests assume instant fills as soon as the signal time is reached.
In real trading, orders travel from your platform to the broker, then to the exchange, and the response comes back with a small but meaningful delay, often in hundreds of milliseconds to a few seconds.
During quiet markets, this delay is negligible.
During a HindZinc spike, the same delay can turn a stop‑loss into a slippage‑heavy exit because the price has already moved beyond your intended level before the order even reaches the exchange.
How Much Slippage Should You Really Assume?
The HindZinc example shows that blindly using a standard 1% number is not enough; slippage needs to be instrument‑specific and data‑driven.
1. Start with Market Microstructure
You can anchor your assumptions to:
- Typical bid‑ask spread as a percentage of option price.
- Total quantity available at best bid and ask.
- Average intraday volume for that strike.
In highly liquid index options, many traders find 0.5–1% slippage adequate, provided smart limit orders and decent infrastructure are used.
For single‑stock options like HindZinc, especially in weekly or near‑expiry contracts, a realistic band might be 1.5–2% for buying strategies on volatile days.
2. Use Your Own Live Trade History
The most powerful way to calibrate slippage is to measure it from your own account:
- Export several weeks of live trades.
- For each trade, compare theoretical price at signal time (for example, LTP from the chart or feed) with your actual fill price.
- Calculate the percentage difference and average it across trades.
Once you know your real distribution of slippage for HindZinc, you can plug that exact figure back into your backtests and stress‑test with both median and worst‑case values.
This closes the loop between historical simulation and your actual trading conditions.
3. Stress‑Test with Multiple Scenarios
Instead of relying on a single “best guess,” run every strategy with at least three slippage settings:
- Optimistic: 0.5–1%.
- Realistic: what your own data suggests.
- Pessimistic: 1.5–2.5% or higher for illiquid names.
If the equity curve collapses the moment you move from 1% to 1.5–2% slippage, the strategy is too fragile for serious capital, no matter how pretty the zero‑slippage backtest looks.
Practical Ways to Reduce the Backtest–Live Gap
The goal is not to eliminate the gap completely—that is impossible—but to make it small, predictable and acceptable.
1. Prefer Smart Limit Orders Over Blind Market
Discussions among systematic traders show that shifting from pure market orders to smart limit or “marketable limit” orders can significantly reduce effective slippage.
For HindZinc, placing buy orders a few ticks above the best bid (rather than hitting a thin ask at any price) can help you participate without overpaying every time.
2. Avoid Hyper‑Scalping Tiny Targets
If your stop‑loss and target distances are just a few ticks away, even normal slippage consumes the entire edge.
Instead, design strategies where:
- Average expected move is several times the typical spread plus your slippage assumption.
- Trading frequency is balanced against liquidity—fewer, higher‑quality trades in names like HindZinc.
3. Forward‑Test Before Scaling Up
Before committing full capital, run the strategy in paper mode or with minimum lot size for a statistically meaningful sample.
Compare forward‑test performance with your “realistic” and “pessimistic” backtests; only if the curves roughly align under those assumptions should you scale up.
4. Accept and Price Residual Uncertainty
Even after careful calibration, there will always be days when live P&L deviates unexpectedly due to flash moves, liquidity vacuums, or technical glitches.
The correct response is to treat this residual difference as a cost of doing business and factor it into your risk per trade, daily loss limit, and expectations from the strategy.
Final Thoughts from the HindZinc Episode
The HindZinc trades on 24 December 2025 are a real‑world reminder that backtests are not promises; they are drafts of how a strategy might behave under simplified assumptions.
A fixed 1% slippage parameter can be dangerously comforting in illiquid or jumpy instruments, masking the true execution risk that shows up only in live markets.
For traders building systematic strategies on single‑stock options, the message is clear:
- Measure your own slippage instead of copy‑pasting generic numbers.
- Test strategies under optimistic, realistic, and pessimistic execution scenarios.
- Focus on robust edges that can survive worse‑than‑expected slippage, not just perfect backtest curves.
When you approach backtesting this way, days like the HindZinc shock hurt less—not because losses vanish, but because they were already priced into your design, position sizing, and psychology before the first order ever went live.